
Detection of Breast Cancer with Microwave Radiometry
Burdina L.M., Vaisblat A.V., Vesnin S.G., Konkin M.A., Laschenkov A.V., Naumkina N.G., Tihomirova N.N.
Moscow mammalogy dispensary (123242, Moscow, Verhniy Predtechnskiy, 8).
Introduction
The increase in breast cancer makes physicians and diagnostic equipment developers to look for new methods for early detection of the breast disease.
Present cancer detection methods other than radiometry (i.e., palpation physical examination, mammography, ultrasonography) require that the tumour have mass and contrast with respect to the surrounding tissue (i.e., they detect formed structure changes in tissues).
The microwave radiometry method (RTM-diagnosis) represents a passive, non-invasive procedure determining thermal activity of tissues. As the changes in temperature precedes the structure changes in tissues there is a fundamental possibility of early detection of breast cancer. In comparison with infrared thermography, reading the infra-red heat radiating from the surface of the body, RTM-diagnosis measures the heat of tissue at depth of several centimetres and so it is more informative.
The another important advantage is that RTM-diagnosis is harmless absolutely, that allows to test a patient repeatedly, analyse dynamics of disease and choose a proper treatment.
In spite of many papers that has been written about RTM-diagnosis [ 1-7 ] , the method has not been utilised widely in medical practice. In our previous paper (Mammalogy №2,1997 [ 8 ] ) there were results of the clinical trial of the medical radiometer RTM-01, which is utilised for breast cancer detection. These results were got by testing 116 women, which had different breast diseases.
Present more than 500 women had been examined and experience of using RTM-diagnosis in conjunction with other methods such as mammography, palpation and puncture has been gained.
For all work the method for diagnosing breast cancer have being improved. The main attention has been given to using PC and improving diagnostic software. Also the methods of imaging internal temperature have been improved.
Methods of examination
The examination was conducted in the Moscow mammalogy dispensary (branch №1).
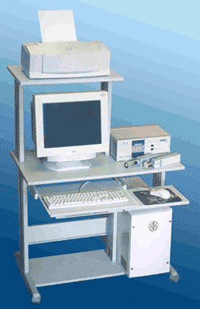
Fig.1 Diagnostic computer based system RTM-01

W omen were divided into several disease groups. The division based on the clinical and x-ray examination data. The data are in the table below.
|
Diagnosis |
Number |
|
|
Examinations |
Patients |
|
|
Healthy |
19 |
17 |
|
Fibrocystic mastopathy |
115 |
107 |
|
Diffuse fibrocystic mastopathy |
89 |
75 |
|
Fibroadenoma |
40 |
38 |
|
Nodal fibrocystic mastopathy |
43 |
42 |
|
Cyst |
53 |
46 |
|
Fibrous-fatty involution |
18 |
18 |
|
Papilloma |
13 |
12 |
|
Acute mastitis |
17 |
9 |
|
Breast cancer |
89 |
80 |
|
The diagnostic of diseases is being exacting |
40 |
38 |
|
Other diseases |
61 |
57 |
|
Total |
597 |
539 |
There is a difference between the number of examinations and patients because some patients were examined several times in order to physicians could analyse dynamics of disease.
The method discussed in our last paper was used. Patients had clinical and x-ray examinations, if it was necessary they had puncture. Then they had RTM-diagnosis and the results were compared.
Fig.1 illustrates the diagnostic computer based system RTM-01, which was used. It consists of microwave radiometer and PC.
Visualisation of Internal Temperature Field
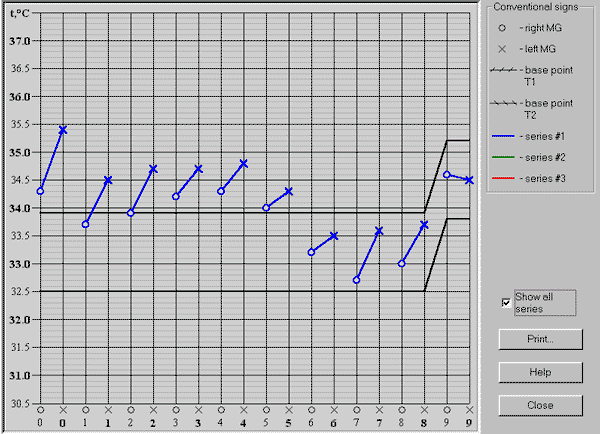
Displaying temperature data as a diagram (fig. 2a), when the names of the points, which were measured, go along the horizontal axis and the temperature values are along the vertical axis, is not obvious enough.
a.
b.
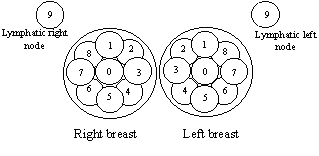
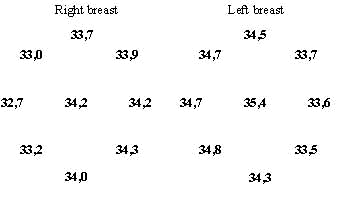
Fig. 2 Various imaging methods of RTM-diagnosis results. A 67-year-old female having cancer of left breast:
a) Thermogram (light area is an area representing breast temperature of the healthy women at the certain age);
b) Displaying temperature, method [9];
Maligin A.A. [ 9 ] (1993) used another method for displaying the internal temperature (fig. 2b). The advantage of this method is the temperature values are linked with measured sites. However this image interpreted hardly.
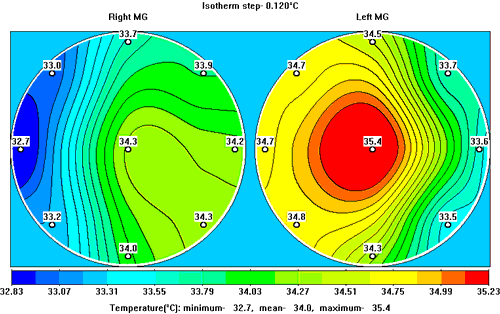
Finally, Land D.V., 1987 [ 10 ] , used method for displaying the internal temperature, when isotherm lines are drawn through sites having the same temperature (fig. 2c).
c.
2 c) Internal temperature field, method [10]
When this method is used, a thermal abnormality is displayed well. It can represent a malignant tumour.
The investigation results show that a thermal abnormality locates where the tumour is, in the 85% of studies, or an error does not exceed a few centimetres.
When an image is grey, hot areas of the breast are displayed by light colours and cold ones are reflected by dark colours.
When an image is colour, cold areas of the breast are displayed by "cold" colours (i.e. blue) and hot ones are reflected by "warm" colours (red and pink).
Basing on common physics laws we can say that the minimum size of image features is proportional to the wavelength used. The wavelength in the biological tissue of 2 - 4 centimetres usually is used, so on the internal temperature field there are no features which sizes are less than 1-2 centimetres. Note, the thermal abnormality size (area having the high temperature and sometimes representing a malignant tumour) usually is larger than the actual tumour size reported by mammography. This is because tissues surrounding the tumour are heated due to heat transfer and neurohumoral links. So resolution of the method does not contradict the size of the thermal abnormality which is investigated.
Fig. 2c shows a significant thermal asymmetry when nipple heat of right and left breasts are compared. The thermal differential is about 10C.
The comparison of displaying methods, shown in fig. 2, says about undoubted advantages of the last one. In the bottom of the image there is a colour scale bar representing colour and corresponding temperature.
Imaging thermal data as internal temperature fields show areas having low or high temperature obviously. At the same time a thermal asymmetry value (temperature differential between the corresponding points on the right and left breasts) is shown in a thermogram better (fig. 2a). Therefore a physician conducting RTM-diagnosis may use both this methods.
RTM-features of Breast Cancer
As we wrote in our last paper [ 8 ] there are the following RTM-features of breast cancer: increase in nipple temperature in comparison with the average breast temperature, local thermal asymmetry, (i.e. there is a high temperature in the point, where a tumour locates, in comparison with the temperature in the corresponding point on the healthy breast), large temperature diversity within one breast, significant thermal differential between corresponding sites on the right and left breasts.
Analysis of a great number of thermograms has showed that different cancer types have different RTM-features.
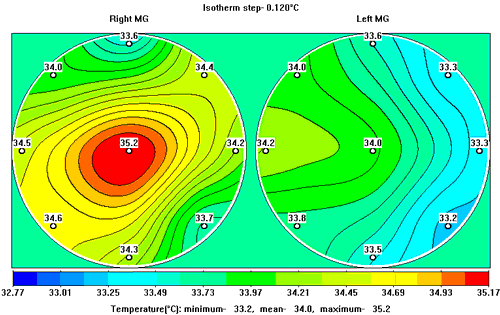
In particular, an increase in nipple temperature (1,0-1,50C) and significant thermal asymmetry (more than 10C) on several points accompany ductal cancer. Fig. 3 shows internal breast temperature field of a 58-year-old female.
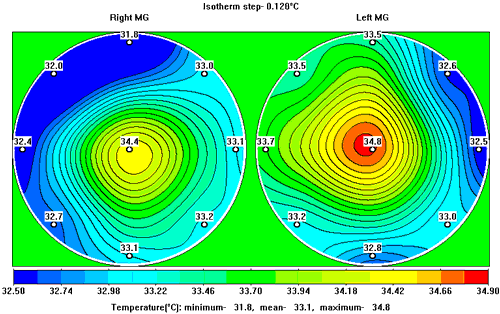
Fig. 3 Internal temperature field of a 58-year-old female. Ductal cancer of left breast
She has ductal cancer. There is significant thermal asymmetry and the high temperature in the left breast. This cancer type has characteristic attributes and there have not been any mistakes of detection. For comparison, fig. 4 shows internal breast temperature field of a healthy female.
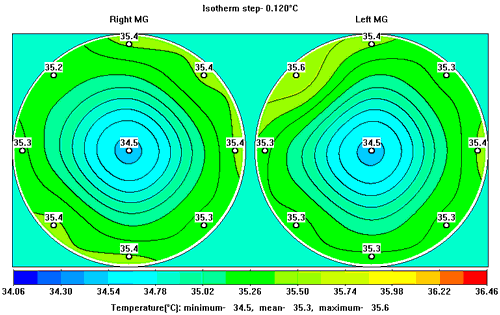
Fig. 4 Internal temperature field of an 18-year-old female. Healthy
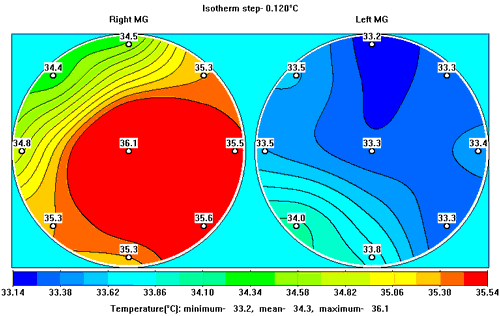
Fig. 5 Internal temperature field of a 60-year-old female. Inflammatory cancer on the right breast
The increase in temperature (1,0-1,50C) in the entire breast accompanies inflammatory cancer, in contrast to ductal cancer. The fig. 5 shows the internal breast temperature field of a 60-year-old female, having inflammatory cancer on the right breast.
Fig. 6 Internal temperature field of a 52-year-old female
a. before treatment (27.03.1997);
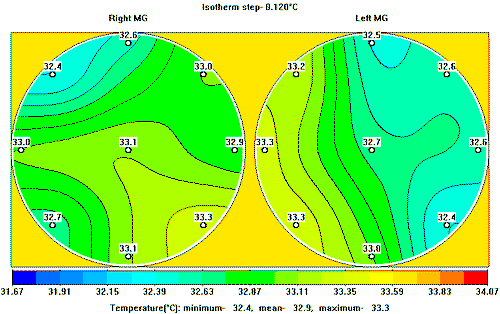
Fig. 6 Internal temperature field of a 52-year-old female
6 b) after the treatment (03.07.1997)
It needs to say that RTM-features of inflammatory cancer are similar to RTM-features of acute mastitis. However the fact that the RTM‑diagnosis is harmless allows physicians to order conservative treatment if there are suspicions of acute mastitis and then repeat RTM‑diagnosis. This allows to compare results and analyse dynamics.
Fig. 6a and 6b show internal temperature field of a 52-year-old female. The first figure shows RTM-results got before conservative treatment. The second is RTM-results got after conservative treatment. It confirms that there is no cancer. Fig. 6b demonstrates positive changes in the internal temperature. (A fall in temperature is 20C). Thermal asymmetry has been also reduced. It needs to say, the significant thermal asymmetry is not always accompanies breast cancer.
In 25% of all patients it is less than 0,70C. These patients have higher temperature in the both breasts and slight thermal asymmetry.
According to our observations if woman is fat, the lower average breast temperature, significant thermal asymmetry (more than 1,00C) and the high nipple temperature accompany breast cancer.
Women with large breast do not always have significant nipple thermal asymmetry (in particular, if tumor is on the periphery). The breast internal temperature is a very "subtle" parameter and it is affected by hormone processes, patient's emotion and medicament treatment. In particular the thermograms of the women taking hormonal preparations such as contraceptive or drug are similar to the cancer thermograms. In some cases the thermograms of the healthy women during the period of menstruation or ovulation are similar to the cancer thermograms and have all RTM-features of cancer.
Most of mistakes were made when women were tested during the period of ovulation. So RTM-examination should be conducted from 6th to 7th day from the first day of the menstruation period for reliable results.
Computer RTM-Diagnosis of Breast Cancer
Breast cancer has different RTM-features depending on a patient age, breast structure, a cancer type, etc.
Significant thermal asymmetry accompanies non-cancer diseases too. In particular 44% of patients diagnosed with non-cancer diseases have thermal asymmetry exceeding 0,70C. So cancer thermogram should be distinguished from other breast diseases.
When computer RTM-diagnosis is conducted all thermograms of verified breast cancer are stored in a computer. Then the software compares a current thermogram with those thermograms of verified breast cancer and analyzes whether the current thermogram (the thermogram of the diagnosed patient) is similar to those cancer basing on thermograms basing on the RTM‑features described above. These RTM-features were represented as numerical values.
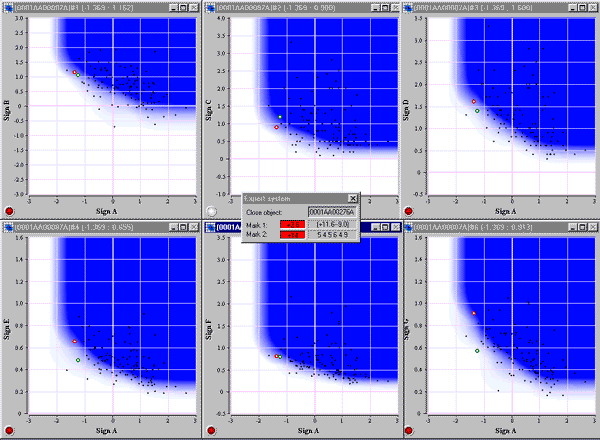
Fig. 7 “Risk areas” at the monitor display.
Parameters of all patients having breast cancer are displayed as a 2‑D diagram (fig. 7). Each patient is represented by one point. The RTM‑features and their links were selected so as to points were compact in the diagram. This compact area is called a "risk area". The change of temperature, depending on the patient age, was taken into consideration.
If the patient’s parameters for all RTM‑features of breast cancer locate within "risk area", this patient is similar to the cancer patients and software, basing on processing results, give a massage that the patient has breast cancer.
Note that the reliability of these results increases as data is being collected.
The clinical trial has shown that sensitivity of the breast cancer detection with RTM-diagnosis is high enough.
In the 56 of 59 studies RTM-results were confirmed by x-ray and clinical examinations. Three cancer patients did not have any cancer RTM-features. In the 15% of all patients (89 patients) cancer was not detected with x-ray and clinical examinations. But these patients had all RTM-features of cancer. However in two cases breast cancer was detected in a few months after RTM-diagnosis had detected it.
Discussion. RTM-diagnosis and Tumor Development Kinetics
In the paper written by Carr K.L. (1989 [ 6 ] ) and discussing the use of microwave radiometry for early detection of breast cancer and in the later paper of Moiseenco V.B. and Semiglazova V. F., 1997 [ 1 ] , the period of the disease is divided into preclinical and clinical phases. During the preclinical phase a tumor can not be detected by the traditional methods.
In the mentioned papers doubling time of the tumor (its volume, mass or number of cells) was discussed. Note that in spite of the large diversity of doubling time (according to [ 11 ] , from 3 to 888 days) the development of the tumor is represented by exponential curve, i.e. double time is constant over the whole period of the tumor development.
The paper [ 6 ] described that the tumor specific heat-segregation was inversely proportional to the doubling time value, i.e. a tumor having short doubling time is “hotter” and so it is displayed better in thermograms. Thus microwave radiometry has a unique ability for detecting the tumor which develops quickly. Using RTM-diagnosis in conjunction with other traditional methods allow physicians to select patients having quickly developing breast cancer (short doubling time of the tumor). These patients are quarter of all cancer patients.
In conclusion there are some examples when RTM-diagnosis had detected breast cancer before the clinical examination detected it.
1. A 49-year-old female (fig. 8). In the February, 1997 she was diagnosed with fibrocystic mastopathy by the clinical and x-ray examinations. Cancer was not found.
However this patient had all RTM-features of breast cancer. The thermogram and internal temperature field (fig. 8a and 8b) demonstrated thermal asymmetry in the outer quadrants of right breast and increase in temperature in the left nipple. In seven months cancer of the both breasts was detected by the clinical and x-ray examinations (inner quadrant boundaries of right and left breasts).
2. A 58-year-old female (fig. 9). In January, 1997 she was diagnosed with acute mastitis by the clinical and x-ray examinations and a treatment was order. In June, 1997 after the treatment: the clinical examination - there is no nodal neoplasm, x-ray examination – fibrous‑fatty involution; mammogram - there is no significant dynamics and there are fibrous parts in the central breast sites (more in the left breast). RTM-diagnosis - all RTM‑features of breast cancer (fig. 9a, 9b). In the September breast cancer of the left breast was detected by histology identification.
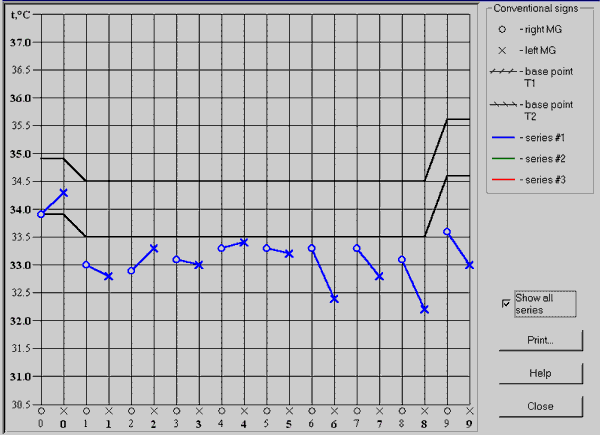
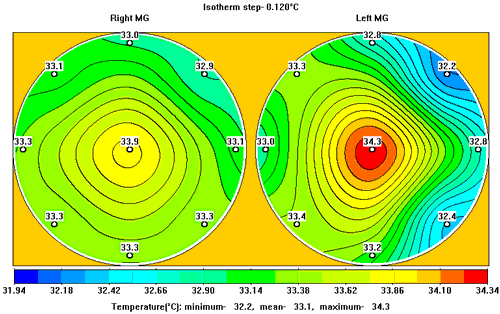
Fig. 8 RTM-results of a 49-year-old female:
a) Thermogram;
b) Internal temperature field
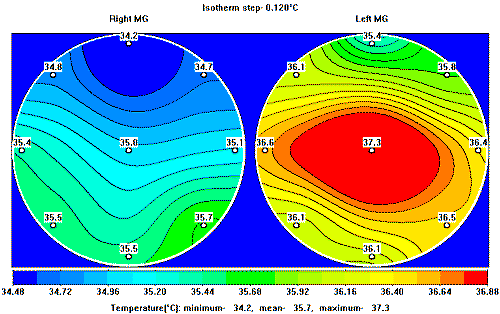
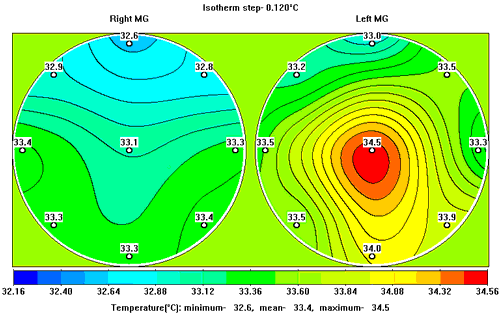
F ig. 9 RTM-results of a 58-year-old female:
a) Internal temperature field, January, 1997;
b) Internal temperature field, June, 1997
Conclusion
A large group of the women was examined.
The results of this work showed that sensitivity of breast cancer detected with RTM-diagnosis using computer processing methods is high enough (90%). In the some cases RTM-diagnosis detected breast cancer earlier than the traditional methods. Perhaps the number of such cases will increase, as the patients having false positive RTM-results are under monitoring.
Due to high detective ability of breast cancer, absolute innocence of RTM-diagnosis, low cost of diagnostic device in comparison with ultrasanography and mammography devices RTM-diagnosis is appropriate to be utilized in out-patients' clinics in order to select patients falling into risk group and then examine them and treat at the special centers.
Besides that RTM-diagnosis can be used as a method for early detection of breast cancer and for monitoring treatment in conjunction with other methods such as mammography, palpation and puncture in the mammalogy dispensaries.
Summary
539 women having various breast diseases have been examined with the help of microwave radiometry, PC computer has been used. It is concluded that thus breast cancer may be revealed with high detective ability (being more 90%) which is about that for mammography examination. Potential possibilities for detection breast cancer at an early stage and for revealing patients having high growth of breast cancer have been also pointed out here.
Literature
1. Barrett A., Myers P.C., Sadowsky N.L. Detection of breast cancer by microwave radiometer. Radio Sci.-1977. -Vol. 12, №68-P.167-171.
2. Ludeke K.M., Kohler J., Kanzenbach J. A new radiation balance microwave thermograph for simultaneous and independent temperature and emissivity measurements // J. Microwave Power. - 1979. -Vol.14, №2. -P.117-121.
3. Троицкий В.С. К теории контактных радиотермометрических измерений внутренней температуры тел. // Изв. вузов. Сер. Радиофизика. - 1981. - т. 24, №9- с. 1054.
4. Сборник трудов всесоюзной конференции “Методические вопросы определения температуры биологических объектов радиофизическими методами” (Звенигород - 84) М.1985.
5. Рахлин В.Л., Алова С.Е. Радиотермометрия в диагностике патологии молочных желез, гениталий, предстательной железы и позвоночника. Препринт № 253, Горький, НИРФИ, 1988.
6. Carr K.L. Microwave Radiometry: its Importance to the Detection of Cancer. IEEE MTT, vol. 37 № 12 Dec. 1989.
7. В.М.Поляков, А.С.Шмаленюк СВЧ- термография и перспективы ее развития. Электроника СВЧ, вып.8(1640) Москва 1991г.
8. Бурдина Л.М., Вайсблат А.В., Веснин С.Г., Тихомирова Н.Н. - Маммология 1997г. №2 стр. 17-22.
9. Малыгин А.А. Радиотермометрия в диагностике заболеваний молочной железы. Диссертация на соискание ученой степени кандидата медицинских наук. Н.Новгород, 1993г.
10. Land D.V. A clinical microwave thermography system. Proc. 1987 - vol. 134 - p.p. 193-200
11. Моисеенко В.М., Семиглазов В.Ф. Кинетические особенности роста рака молочной железы и их значение для раннего выявления опухоли. Маммология, № 3, 1997г, стр. 3-12.